Understanding Traffic Flow in Google Cloud — A Visual Walkthrough
A metaphor-driven guide to explain how client requests navigate through load balancers, firewalls, compute, and observability layers in GCP.
Intro:
In the world of cloud architecture, understanding how a request flows from a user to an application is critical.
Whether you’re designing for performance, security, or scalability — your architecture begins with this foundation.
To make this easier (and a bit more fun), I visualized the entire traffic path using a traffic route analogy.
Here’s a breakdown of that journey — through toll gates, security checks, surveillance, and finally, arriving at its destination.
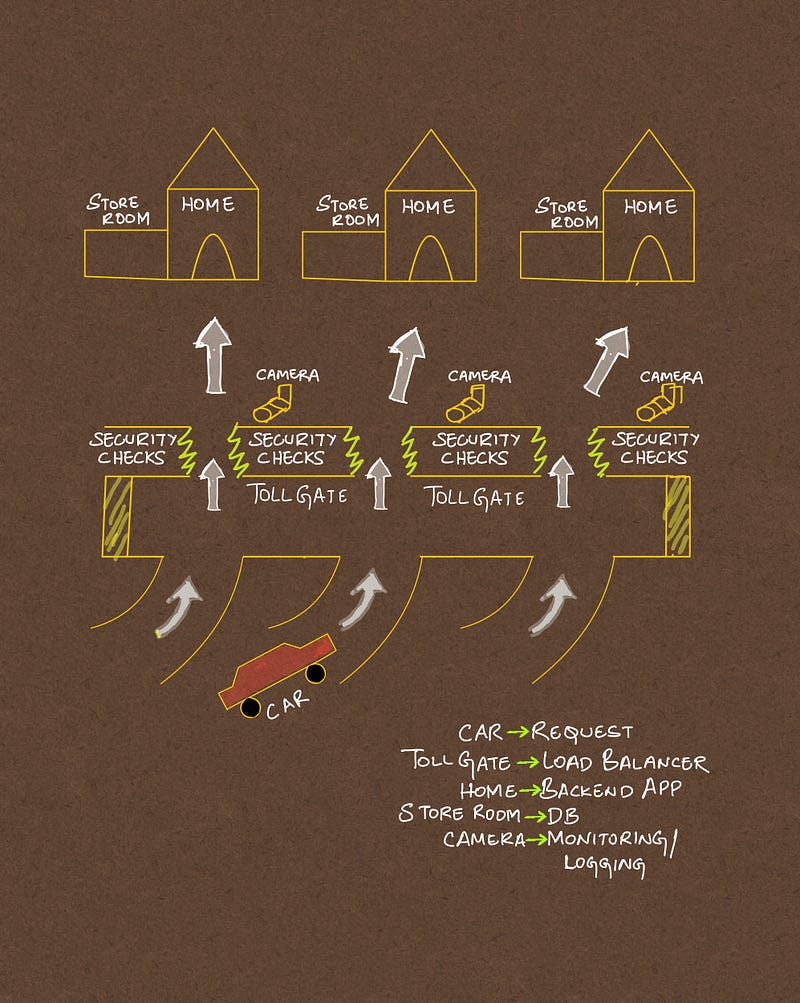
GCP traffic flow — explained like a road trip.
Breaking Down the Metaphor:
1. Car = Client Request
Just like a car starts its journey from a road, user requests originate from a client (browser, API client, mobile app, etc.)
2. Toll Gate = Global External HTTPS Load Balancer
This is your first line of entry — it routes traffic globally, handles SSL/TLS termination, applies URL maps, and selects the right backend service based on rules.
Think of this as a well-automated toll booth — directing cars (requests) to the right lanes (services).
3. Security Checks = VPC Firewall Rules
Before the request reaches any resource, GCP’s firewall rules come into play. These control who gets in and what traffic is allowed.
In our analogy, it’s like showing ID at the checkpoint. If the car doesn’t meet the criteria, it doesn’t go forward.
4. Camera = Logging & Monitoring
Every step of the journey should be observable. GCP offers Cloud Logging and Monitoring for this.
Just like traffic cameras watch and record everything for later analysis, logs and metrics help you audit, alert, and diagnose.
5. Home = Backend App (VMs, GKE, Cloud Run)
This is the compute layer where the magic happens — your application lives here.
Once requests are through routing and security, they hit the actual workload — VMs in an unmanaged instance group, GKE Pods, or a Cloud Run service.
Store Room = Database (Cloud SQL, Firestore, etc.)
Often, applications need to interact with a database — this is the storage layer.
Like a home’s storeroom, the app retrieves and stores critical information here before responding to the user.
Observability Across the Stack:
Observability is not a separate layer — it’s built into each stage:
- Load Balancer logs
- Firewall logs
- Application logs
- Database performance metrics
GCP integrates these into Cloud Operations Suite (formerly Stackdriver), giving architects full-stack visibility.
Why This Matters:
- It helps new engineers visualize how GCP networking works.
- It simplifies troubleshooting: if something breaks, you know which “checkpoint” to inspect.
- It helps you design with clarity — from security policies to autoscaling strategies.
Final Thoughts:
Whether you’re building high-traffic apps or simply experimenting with cloud architecture, mastering this basic traffic flow can set the foundation for all your cloud designs.
If this sketch helped you think differently, feel free to share it or adapt it to your environment.
I’ll be posting more of these simplified visual explanations for key cloud concepts.
Drop a comment or connect with me on LinkedIn if there’s a topic you’d love to see visualized!
About the Author: Akhil is a Cloud Architect at Google, passionate about simplifying complex cloud concepts with real-world analogies and visual storytelling.